BLOG

The following is a paginated index of all my personal blog posts in reverse date order. I try to keep these reasonably formal and on topics relating to building performance analysis, computer programming, interactive 3D visualisation and web development. For some of my more off-topic and opinionated musings, see the Soapbox section.
Revitalising My Website

I have been a bit myopically focused on completing my new BIM framework for the past few years, to the exclusion of most other things. However, that seems to be how I get stuff done, and I _really_ needed to get that done. Ten man-years for a software project is not actually that much, but it still takes me ten years. Thus, it's pretty amazing now to be slowly coming out the other end of it. I also have a heap of half written posts about development stuff that I encountered over that time, so my New Year's resolution for 2025 is to revitalise my website, get some posts finished and demo apps released, and then respond to the absolute mountain of messages I have received in the interim.
Two New Christmas Apps
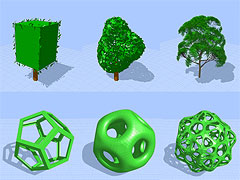
Christmas school holidays can be tough if you work from home, but I was able to get a couple of little projects done that I have had rolling around in my head for quite a while. The first allows you to create low-poly 3D trees of various levels of abstraction, and the second lets you view simple polyhedra and apply sequential geometric operations to generate higher-order shapes and forms.
Some New Solar Articles

Whilst writing some new documentation for my solar analysis API classes, I kept adding way too much background information, making them far too long to actually read. At that point I knew I had to separate that stuff out, so decided to add them as a series of articles on PerformativeDesign.com.
The Wonders of Duck Typing

Having immersed myself entirely in JavaScript for the past few years, going back to something like C# should have been a bit of relief. However, it mainly served to highlight just how inflexible and full of unnecessary overhead C# is, and just how much I love the flexibility and interoperability of JavaScript. This particular post details one of those ridiculous situations that languages like C# often create, with a relatively simple app containing at least 6 different classes/structures for storing 3D position data, many of them pretty much the same but entirely incompatible with each other.
The Profligacy of Immutability

There have been a couple of times over the past few months where I have run into major performance issues due to excessive garbage collection when trying to create dynamic models that work with immutable data objects used in 3rd-party code. Even just one or two immutable classes in a library can have huge flow-on effects. I have no problems with functional programming and immutability per se, but when that code starts gorging on new memory and leaving behind a trail of garbage for others to clean up, then it's time to register a complaint.
Sky Distribution Equations

A number of people have asked me for more information about a comment I made in the CIE Sky app description about using the "latest" sky distribution equations. Basically, whilst trying to work out why the numbers I was getting from my implementation of the CIE Standard General Sky were slightly different to those from other popular daylight tools, I noticed that all of them appeared to be based on code that implemented the original Perez All-Weather Sky equations published in 1993, rather than the CIE Standard General Sky equations from 2003. The differences between the two are relatively small, but certainly enough to confound any direct numerical comparison.
Architects and the R-Codes

Having recently submitted some planning applications in Western Australia, I have had to get pretty familiar with the local Residential Design Codes (R-Codes) that apply there. Not just the codes themselves, but also how they are interpreted and dealt with by local councils. At first take, the R-Codes really do appear quite progressive and thoughtfully written. However, they have been evolving and changing over many years and there is still a lot of legacy in their implementation that can make life particularly hard for an architect.
Recent Service Interruption

As you may have noticed, my blog has had quite a few outages lately which hopefully have now been sorted out. However, after some long-running issues with the occasional html file simply disappearing, my web hosting service provider has recently upgraded their infrastructure and, in the process, blown up most of my other Drupal-based sites.
New Schedule Editor
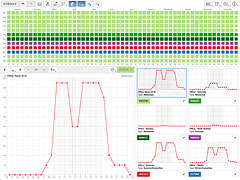
I have finally finished my online annual hourly schedule editor, which took several iterations and quite some time to get working the way I wanted. It's of interest because hopefully its relatively easy to use and can read and write schedules in a range of different formats, including EnergyPlus (IDF and epJSON), OpenStudio (OSM), DIVA/DaySim (.OCC.CSV) and some other CSV layouts.
Why Educational Tools

A common question I get, both directly and indirectly, is why do I spend so much time on what seem to be pretty limited educational apps rather than doing a full-on building analysis tool that can handle real projects. I documented this at the start of a recent research paper , but figured that I should probably summarise my reasons here as well.
JSON Settings
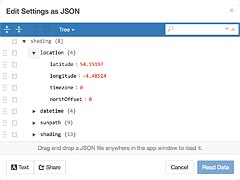
Quite a few people have asked lately about the settings editor in my web apps and how to use it. Actually most of the questions were more along the lines of 'why on earth do you use JSON for storing settings in your apps, and what’s with that weird editor?'. Well I have one or two good reasons for both, which I shall endeavour to explain.
Two New Web Experiments
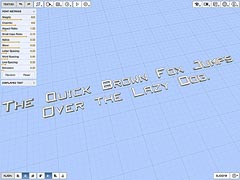
As part of adding support for scriptable tutorials, I had to create my own 3D vector font and annotation libraries. Both are intended to be highly dynamic and customisable so I wrote a couple of apps that interactively control their properties to thoroughly test them. As a bonus, these apps also serve as font and annotation designers, allowing you to do visual customisations and then copy/paste the code required to create that text or annotation in a script.
Long Time, No Blog

Whilst I have actually been writing a bunch of stuff for my blog, nothing has seemed sufficiently insightful or complete enough to post for quite a while. However, I've reached a bit of tipping point now and desperately want to get some of it out there, but just don't have time to polish it into anything other than what it is. Thus I've decided that I am just going to put it up regardless, so apologies in advance...
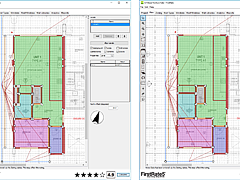
Moving From Drupal to Hugo
My content management system of choice is Drupal. It has served me pretty well and allowed me to do a lot of things I probably could never have done without it. However, it has become such an attention seeker these days; with security issues, module upgrades, heavy comment spam and database blowouts seemingly weekly events. Also, upgrading to the newest version is never as smooth as promised. Thus, instead of upgrading my blog to Drupal 8, I have dumped it entirely and moved to a completely static site using Hugo.
Understanding WebGL

My biggest issue with WebGL, and actually all non-immediate-mode OpenGL, is constantly fighting with the requirements of vertex buffers and attributes. I seem to be always looking for ways to minimise and optimise memory whereas vertex buffer objects always seem to want me to waste large amounts of it with duplicate attributes. However, reconciling that requirement in my own mind has actually given me a bit of insight into potentially alternate uses for the WebGL render pipeline.
BIM and NatHERS Headaches
Given that my blog doesn't get updated much and there is no other obvious output, lots of people ask me what exactly I am working on at the moment and why it seems to be taking forever. Usually I just mutter the odd platitude, but today I thought I would combine a bit of a rant with an actual example of the kind of problems I am currently and seemingly constantly wrestling with. This one involves the ideal of determining NatHERS compliance directly from a fully integrated building information model (BIM).
Web Experiments
PerformativeDesign.com has gone into a short code-freeze for some external testing now so I have finally got a bit of time to catch my breath. As part of that work, I have had to do quite a few small experiments and proofs-of-concept, just as a way of seeing what was possible and then working out the best ways to do various things. Some of these were a bit interesting and often a lot of fun so I thought I'd polish up a few and make them available as a small taster of things to come, hopefully quite soon.
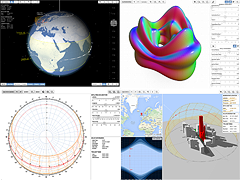
Earth/Sun Relationship Update

I've been doing a fair bit of low-level optimisation work on my solar calculations code recently and, whilst I have a reasonably extensive test suite for it, nothing beats being able to actually see things in action and interactively put them through their paces. Also, I've been wanting to update my old Earth/Sun Relationship app for a while now with some new ideas and graphics, so the synthesis seemed pretty logical. Thus, I just finished a brand new version with lots of new features as a way of both examining and visualising the relationships involved and letting me test and validate the core code.
Processing Libraries - Where are They?

As I've mentioned in previous posts, I have been working on a graphical user interface and 3D modelling library in Processing for some time now. I originally chose Processing because it was truly cross-platform and the only tool that also supported embedded web applets. I got to a reasonably advanced state in v1.5.1 and then, of course, everything changed. Processing 2 moved entirely to OpenGL and completely abandoned web applets.
Dynamic Charts in WPF

There are a plethora of WPF charting solutions out there, both commercial and open source. I have tried quite a few but have yet to find one that is capable of handling highly dynamic data whilst also providing useful customisations such as centered axis or generating polar diagrams. I do most of my dynamic charts in OpenGL but labelling axis and data points using textured fonts lacks some of the polish I have seen in many WPF-based solutions. Thus I thought that, for my Windows apps, I would try porting my OpenGL chart library to WPF.
The New Normal

My wife and I had a bouncing baby boy late last year and man, did he arrive like a shrieking banshee from hell. That was four months I hope never to experience again and, thanks to some serious and prolonged lack of REM sleep, I hope soon to forget. Like all new parents, you just dig in and pray for things to slowly get back to normal. However, with the passing of time comes the dawning realisation that this is the new normal. Even though I really liked my previous life, this post isn't a rant about that. It's about some of the things I've discovered about my new one.
Event Handling in Analysis Classes

As I have mentioned in a couple of other posts, I have been working on the API for a suite of building performance analysis classes, with a particular focus on dynamic visualisation and interactive manipulation. Part of this involves implementing an event notification system so that changes can propagate through even the most complex object hierarchies without the user having to worry about the internal plumbing. Unfortunately the standard approaches that I have found aren't particularly suitable here, so I have had to hack out something of my own.
Where's the Point in 3D APIs
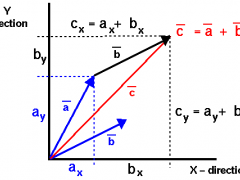
Whilst working on an analysis library recently, I have been trying to reconcile how best to define positional and directional information. Most 3D frameworks and Application Programming Interfaces (API) use a single Vector class (or similar) to define a generic object with X, Y and Z properties, which is then used interchangeably to describe both points in space and direction vectors. The closer I look, however, the more I think that it's important to clearly distinguish between the two and treat them as separate classes in an API in order to avoid inadvertent user mistakes. Unfortunately there is no single knock-out justification for either approach, so the following are some simple contemplations on the subject as I try to work out which way to go.
Designing for Sub-Classing in Java

One of the projects I have been working on over the last few months is a graphical user-interface (GUI) library for Processing. The Java API to the library makes extensive use of sub-classing and the intention is that it be easily sub-classed by the end user to allow for deep customisation of its functionality. Deep customisation means allowing for any property in any of its classes to be easily overridden. Sounds trivial as this is what object-oriented programming and Java is all about, but it actually leads to an interesting code-design dilemma.
Fast 3D Vector Text in Processing

Technical illustrations and 3D graphs tend to need lots of different kinds of text - some bold/italic, some large/small, and often in a range of different colors or shades of grey. Having struggled with image-based font glyphs in 3D for ages, I've kinda had enough - so set out to develop my own parametric vector text in Processing/OpenGL. This applet is a demo of some of the types of 3D text object I've been playing with as well as some experiments with annotation arrows.