DYNAMIC CHARTS IN WPF
There are a plethora of WPF charting solutions out there, both commercial and open source. I have tried quite a few but have yet to find one that is capable of handling highly dynamic data whilst also providing useful customisations such as centered axis or generating polar diagrams. I do most of my dynamic charts in OpenGL but labelling axis and data points using textured fonts lacks some of the polish I have seen in many WPF-based solutions. Thus I thought that, for my Windows apps, I would try porting my OpenGL chart library to WPF.

The result is definitely very close to what I was after, though there were a few hurdles getting them as fast and as crisp as I needed. This post outlines the process and what was required to overcome these hurdles.
Overview
The key requirement for charts in my current project is redraw speed as I need to display quite a few different types of chart and update them all dynamically in response to user interactions. Thus, the faster they update, the better the user experience and the lower the machine specification required to maintain that user experience. For charts in all other platforms I use OpenTK and QuickFonts. However, for .NET and Windows I have written my own OpenGL control that integrates pretty well with WPF, avoiding all its air-space restrictions by blitting the framebuffer directly to a WPF ImageSource. But this means not being able to use external libraries such as OpenTK or QuickFonts, so labelling is my big bugbear at the moment as I can’t seem to accurately calculate the size of formatted text - which makes centering and right-alignments a bit of a hack. Thus, for my 2D charts in Windows, I figured I could use WPF directly.

When looking around for a WPF chart solution, the Dynamic Data Display project on Codeplex initially looked to be what I needed. It’s got a pretty good API, is highly customisable and is certainly fast enough with dynamic data. However, polar diagrams (circular charts) and centered axis are quite difficult to achieve without actually modifying the codebase. Also, the line-work used for axis and ticks are all anti-aliased so I couldn’t get the exact look I was after without, again, modifying the codebase. Most of the commercial solutions also looked good initially, but there was always some customisation or specific chart type I couldn’t do.
Thus I figured that the best overall approach was to abstract my existing chart library so that I could simply plug in different render providers, OpenTK and WPF being the initial ones, but then maybe I could look at formats like PDF and SVG in the future, etc.
Faster Rendering Speeds
The first issue with WPF charts was achieving the rendering speeds that I needed. My first experiments with a WPF Canvas and using UIElement-derived objects such as Lines, Polylines and TextBlocks weren’t anywhere near the mark. Dynamic updates were surprisingly slow and generated significant CPU usage and garbage collection issues. I suspect that this was mainly due to how PointCollections were being managed within Polylines as, in many of my chart types, the point count in each one often changes so you need to keep creating new ones.
OnRender() and DrawingContext
I then looked at overriding the Canvas OnRender()
method and using the basic primitives offered by DrawingContext
. These are a bit limited - offering only lines, rectangles, ellipses, text, images and composite Drawing
objects - but for simple charts they were more than enough for my needs. Using these solved the CPU usage and garbage collection issues as I could maintain my own data arrays and modify them directly, without having to constantly create new PointCollections. However render times and frame rates were still quite slow. I suspected that this was mainly due to the DrawingContext.DrawText()
method having to format all the titles and labels on each axis during every redraw, so I began to look for a way to cache formatted text.
Caching Formatted Text
It turns out that you can use a TextFormatter
to format a line of text into a TextLine
object, and then simply draw that within a
DrawingContext
in any position you want. Doing this is a bit laborious as you have to create and populate all the TextRunProperties
, TextSource
and TextParagraphProperties
objects that define the formatting you want, but all this can be pretty easily encapsulated into just a couple of methods. In my case, this meant I only needed the overhead of reformatting whenever the text values actually changed, not when the axis or tick lines moved around or were redrawn.
After refactoring the code to pre-cache all chart text as TextLine objects, so that the OnRender() method only needed to call the TextLine.Draw() method to redraw the already formatted text, I expected a significant speed increase. However it made very little difference.
Measuring Render Times in WPF
Accurately measuring rendering times in WPF is nigh-on impossible. Using a Stopwatch
inside the OnRender() method gave meaningless results, suggesting that all the rendering was taking less than 3ms when I was only able to get about 10 redraws per second. It turns out that the actual rendering is done in another thread and the 3ms is just how long it takes the DrawingContext to add the chart items to the render queue. I tried several different ways for getting the render time, but the most reliable was simply the overall frame rate - how many times per second the OnRender() method actually got called.
Freezing Resources
The main breakthrough in terms of speed came when I started
Freezing
things. It turns out that, even when using low level DrawingContext primitives, WPF tries to keep track of all the objects that belong to different brushes, pens and other resources so that it can update and redraw them if the shared resource is ever changed. Freezing all the pens used within the chart took it from 10 frames per second straight to 60 frames per second. When a resource is frozen, WPF does not maintain these backward links so I imagine that a lot of cross-checking is avoided. Some of my charts use colour as a value indicator so this is not a total solution, but for those charts that don’t, they render as fast as I need them to.
Interestingly, no matter how simple the chart or cut-down the rendering is, I can’t seem to break the 60 frames per second barrier. I figure there must be some kind of internal limit to how frequently WPF will update itself and haven’t pursued it too much as even dynamically updating several of my most complex charts at once gets frame rates in the mid-forties. I’m sure I’ll have to revisit why this is at some point in the future, but for now I’m pretty happy.
Crisp Pixel-Aligned Line Work
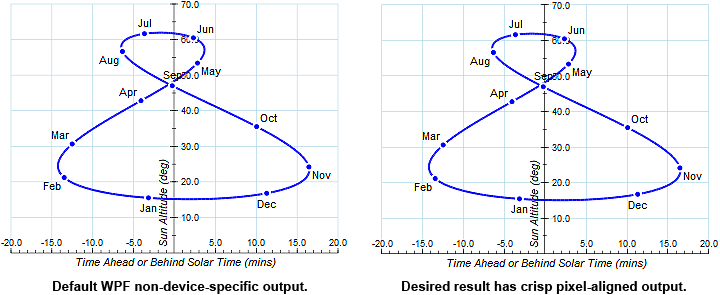
The next issue with WPF charts was getting nice crisp pixel-aligned lines for the background grid, axis and tick marks. I realise that this goes against the whole non-device-specific ethos that WPF is based on, but I’m afraid that having some grid lines blurred and others not is simply unacceptable no matter what your ethos. I could possibly accept it if all lines were equally blurred, but certainly nothing in between.
Figure 2 below shows how normal lines appear in a chart on the left, compared to what I was hoping to achieve on the right. At the bottom of the chart on the left you can see how the crispness of the tick marks varies periodically over the range of the graph. Similarly the light blue grid lines show the same effect in both directions and both the horizontal and vertical axis lines are smeared across two pixels. The chart on the right illustrates how it should look.
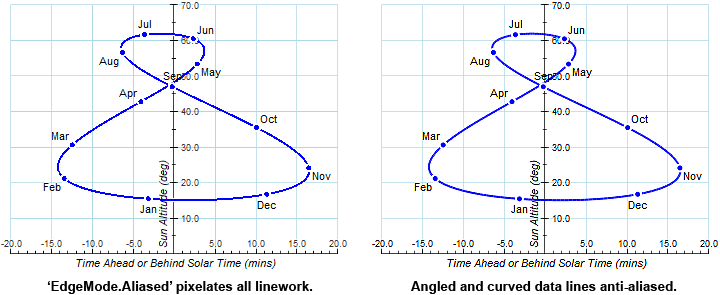
Of course, I don’t want all my lines aliased. Angled and curved data lines, as well as text, should all still be fully anti-aliased. Thus early experiments with the RenderOptions.EdgeModeProperty
of the WPF Canvas set to EdgeMode.Aliased
were definitely not the right solution. Figure 3 shows the comparison between the RenderOptions.EdgeModeProperty set to EdgeMode.Aliased on the left and EdgeMode.Unspecified on the right. In the left chart you can see the pixilation of everything, including the curved analemma line and all its month nodes. The right chart shows what I was after, with only the horizontal and vertical chart components aliased whilst the data lines and label nodes are anti-aliased.
RenderOptions.EdgeModeProperty set to EdgeMode.Aliased on the left with what I was hoping to achieve on the right.You can pixel-align certain horizontal and vertical lines in WPF by first setting up a series of horizontal and vertical guidelines at the positions you want. At first this seems a round-about way of doing things, but it’s actually pretty straightforward and the logic behind it is slowly growing on me. Implementing this in a chart simply meant that each axis stores a GuidelineSet
to which the positions of both major and minor tick marks as well as the axis itself are added. Each GuidelineSet requires X and Y values to be added separately as DoubleCollections. Thus, using a horizontal axis as an example, its tick mark positions are added to the X DoubleCollection and the position of the axis line to the Y DoubleCollection.
Figure 4 compares the difference between a chart drawn without guidelines on the left to one drawn with guidelines on the right. Again, you can see the variation in pixel alignment in the tick marks and grid lines on the left compared to a consistent alignment on the right.
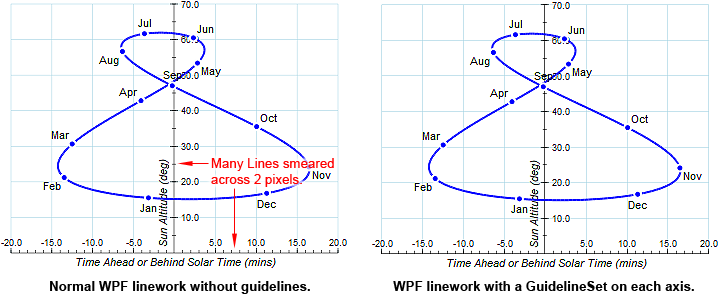
GuidelineSet for each axis on the right.Summary
There were a couple of really good things that came out of this little exercise. Firstly, I got to abstract my chart library so that I can look at a range of different output options and/or render providers in the future. In fact, I just finished two server-based examples, one that generates charts as formatted vertex buffer objects ( VBO ) that my Android and iOS apps can consume to display remote data, and the other one that outputs the chart as X3D or, optionally, embedded within a X3DOM web page so that it can be displayed in any browser that supports WebGL .
The second good thing is that I now know how to do a whole lot more with WPF, using both high and low level elements. For example, it turns out to be trivially simple to overlay a WPF chart over one of my OpenGL controls in order to render fast-changing heat maps (carpet plots, colour grids or whatever else they’re called) whilst still having formatted labels, titles and legends, as well as interactive popups, etc. As the colour of each cell within the chart changes rapidly, freezing the WPF pens and brushes has no benefit whereas I can do this extremely fast in OpenGL by simply modifying a VBO defining the heat map.
One bad thing is that the Canvas OnRender() method is not available in Silverlight, so charts in that still need to be generated with UIElement-based objects. Or this could be a good thing as it means concentrating more in WebGL-based charts for browser-based apps, with Silverlight becoming just one less platform/output that I have to work with.