DYNAMIC OVERSHADOWING
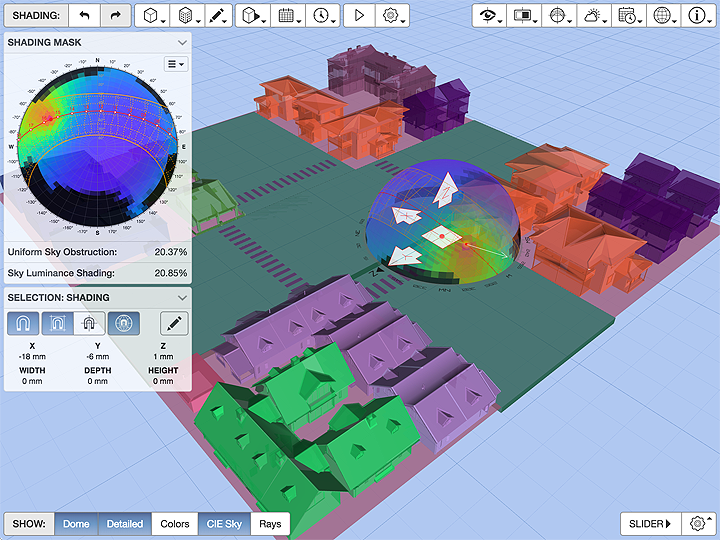
This interactive web app lets you move a point of interest in and around a site and see its shading mask update in real-time. When it first starts, the app displays some simple block obstructions that you can interactively manipulate. However, you can also load in your own 3D design models and examine their overshadowing in the same way.

The aim of this app was to investigate the possibility of generating real-time interactive shading masks using WebGL and JavaScript. A shading mask is simply a map of which parts of the sky dome are visible from a particular point and which are obstructed by opaque objects in and around a site. This is very useful information as it affects daylighting, solar incidence and photovoltaic collection, as well as shading and overshadowing.
The other key aim of this app was to see if I could implement dynamic sky luminance mapping at the same time. The degree of shading at any point is usually quantified based on the percentage of the sky that is occluded. However, this is not really that informative as the luminous distribution over the sky dome is typically quite uneven and can vary significantly over even short time periods. With this app, I can now experiment with a range of different sky conditions, based on the 16 CIE General Standard Sky types, and begin to quantify shading based on the percentage of actual sky luminance that is occluded.
From here, the next steps are to add dynamic time-varying skies based on real weather data and the ability to aggregate luminance and/or radiance over time to look at quantifying seasonal and annual shading effects.
Why a Simple Block Model
Actually you can import any type of 3D model as a .OBJ, .STL or .PLY file. The app only starts out with simple rectilinear blocks as a way of illustrating the process and providing an interactive site that you can immediately start playing around with. To load your own 3D model, use either the button that looks like a building or drag/drop the model file anywhere in the app window.
With large and complex models, the app automatically detects when a calculation is taking too long to be interactive and will try to degrade appropriately. For example, if the detailed shading takes longer than 200ms to complete, it will try to use a simpler method to maintain the dynamic feedback. If the simpler method takes longer than 200ms, it will stop trying to dynamically update until you finish dragging and release the pointer. Sometimes the browser or system might be busy with something else when you drag, causing it to temporarily stop dynamic updates even on a relatively simple model. However, as soon as the calculations return back to speed, the dynamic update will resume automatically.
Background
I started out using pretty straightforward ray-tracing for occlusion testing, which is pretty flexible and allows it to work with any type of triangulated geometry. Whilst there is some scope for optimising both the model and the intersection testing techniques used, and maybe WebGL2 or WebGPU could assist in the future, at this stage it seems unlikely that such an approach will be fast enough for highly dynamic feedback on anything other than the simplest of sites.
However, by simplifying the obstructions to just rectilinear boxes, it can run in very close to real-time - try it out for yourself. Using highly optimised axially-aligned bounding box intersections works astoundingly well, even with several hundred boxes and on a reasonably good phone or tablet.
This is particularly interesting as it suggests that the voxelisation of complex models into tiny rectilinear cells might just be the way forward, allowing for real-time dynamic shading calculations on geometry of any complexity. Why this is interesting is because many fluid dynamics calculation engines require a similar approach to complex geometry. Perhaps there is some synergy there to be exploited.
It turns out that the real bottleneck in terms of speed is dynamically updating the SVG sky segments in the 2D Sun-path chart. You can see this for yourself by choosing a small angle for the sky subdivision (say 2 degrees), closing the SHADING MASK overlay by clicking on its title bar (it will ignore update requests when closed), and then dragging the 3D Sun-path around the site. After a second or so, the updating should become significantly faster and smoother (it takes the JavaScript compiler time to re-adjust its run-time optimisations). I will look into this further, but it may be that I have to use WebGL for the 2D chart as well.
Interesting Features
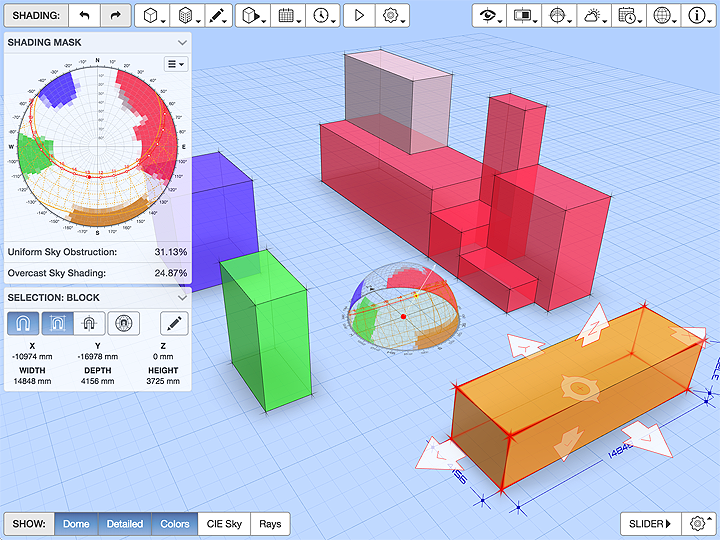
Apart from the actual shading, the first potentially interesting feature of this app is the ability to select and interactively manipulate the obstruction blocks and the shading mask.
To change the size of any block, simply click/tap on any of its bounding surfaces and then drag the appropriate arrow in the direction you want. To adjust the shading mask position, first click/tap on the small red dot at its center and then drag any of the manipulator arrows.
The circular manipulator in the center of a block allows you to change its position. When you position a block such that it is close to the face of another block, it will snap to a position which aligns with that face. By default, this only happens with other blocks that are physically near the block being manipulated. If you wish to snap to other blocks further away, make sure the toggle button with the picture of a magnet inside a globe is selected. Similarly, you can toggle center snapping on or off or even all snapping.
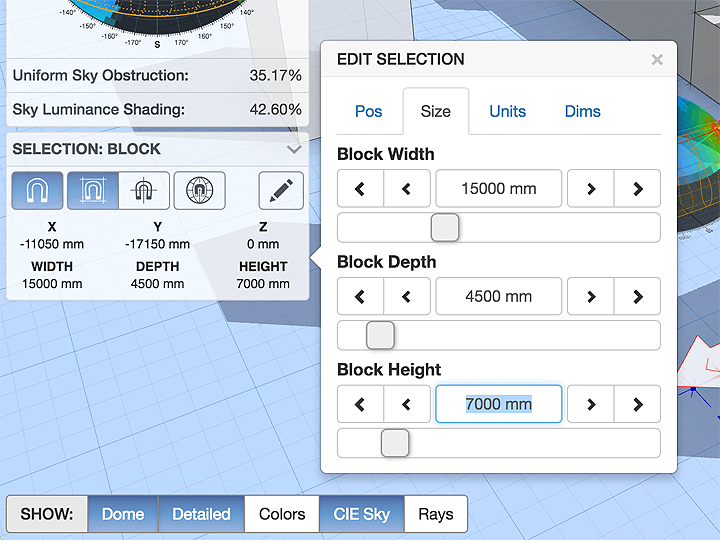
In additional to physically dragging things around, you can edit both the position and size of the currently selected block by clicking in the SELECTION: BLOCK overlay panel or the small button with a pencil in it. This will display the EDIT SELECTION panel, as shown in Figure 3.
Sky Luminance
You can use the Luminance tab in the SKY SETTINGS panel to select from a range of different sky distributions. These are all based on the
CIE General Standard Sky
types. As sky luminance values can vary a huge amount across different sky conditions, the value that is displayed is actually the luminance ratio between the zenith of the sky and each sky segment. Such a scale most clearly displays the nature of the distribution across the sky dome, if not its absolute value.
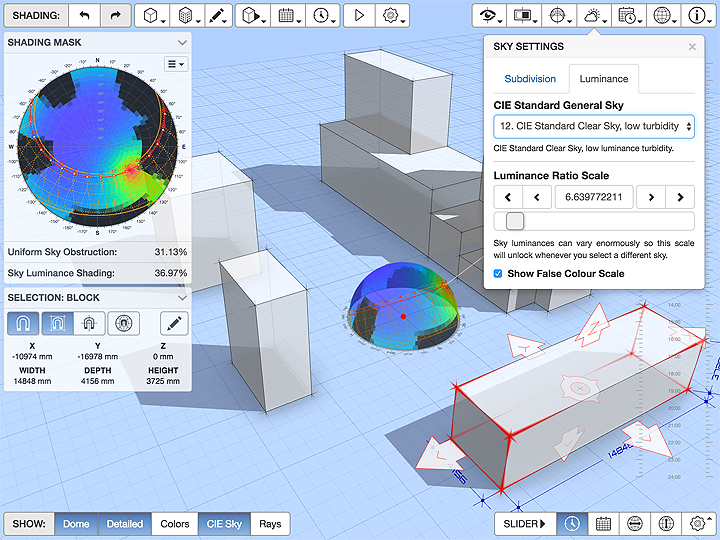
This means that the scale changes each time the sky changes. You can temporarily lock the scale by setting a value in the Luminance Ratio Scale section. The selected scale value will be retained across all subsequent date, time and location changes, but will reset if the sky type changes.
Show Obstruction Color
This feature makes the various shading relationships in the model immediately obvious and understandable. It basically colors each shaded segment based on the color of the object(s) that obstruct it.
I added this feature because I have found this technique very useful in the past when explaining shading masks and how they relate to a particular site. Being able to isolate one or more parts of a 3D model in a different color makes the relationships much clearer.
Shading Rays
Another useful tool for checking a model or trying to understand a particular shading pattern is to actually see the shading rays used to detect obstruction. Only rays that actually hit something are displayed. Each ray terminates at the closest obstructing object.
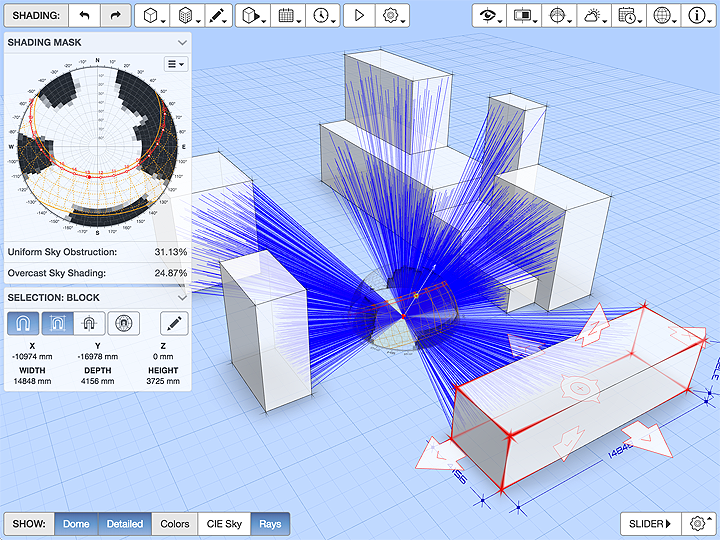
If you turn on the Show Obstruction Color option, the arrow end of each ray will also be colored based on the object it intersected.
Change Log
0.0.8 2017-12-08
Added real-time dynamic merging of overlapping blocks. This uses constructive solid geometry (CSG) to generate the union of any blocks that intersect or butt up against each other as you interactively drag them around. The shape union works incredibly well and is quite robust, even with lots of intersecting blocks, however there is still an occasional issue with edge detection that may result in a leftover line or two that splits a planar face. Solving this one requires a pretty fundamental refactoring of the CSG model which I will do, but may take some time.
Added embedded styles to the exported chart SVG file to make it standalone and no longer dependant on an external style sheet. This also means that you can use any modern web browser to view the resulting SVG and edit its styles if you need to before inserting in a printable document.
Changed the behaviour of the SHIFT key modifier when interactively dragging a hotspot. Instead of temporarily toggling the
Snap to Allfeature, it now snaps to 10x the current snap grid. The CONTROL/META key modifiers now snap to 1/5th of the current snap grid to allow more refined positioning. The previous behaviour caused much confusion as there was no visual indication of what was happening and it is just as easy to press the V key instead to actually toggle theSnap to Allfeature, which also triggers the associated button state change.Fixed an issue with undo/redo after inserting or deleting a block.
0.0.7 2017-10-02
- Added the ability to import 3D model data from ASCII .STL (
stereolithography
) and .PLY (
polygon file format
) files as well as OBJ files. You can use the
Load OBJ, STL or PLY...item in the3D Site Modelmenu, or simply drag/drop the file anywhere in the browser window to load it.
0.0.6 2017-03-19
Fixed an issue where snapping was being performed on the center point of a block when its position was being dragged which seemed logical, but meant that the extents of blocks that were not some even multiple of the snap grid would never align with the ground grid. Snapping is now performed on the minimum position of the block in each axis which works much better.
Added a more descriptive dialog box for saving data within the app, containing a collapsible explanation as to why web pages can’t invoke the system File Save As dialog when saving a remotely generated file locally.
Proximate interactive snapping now hi-lights the aligned faces of the moving block as well as the aligned block.
Added keyboard shortcuts for toggling interactive snapping - O for turning snapping on or off, B for bounds snap, C for center snap and V for model-wide alignment snapping.
0.0.5 2017-03-15
- Added an option to have the color of the shaded sky segment reflect the color of the obstructing object. This also applies to generated shading rays.
0.0.4 2017-03-07
Added ability to select one of the 16 CIE General Standard Sky types and map the resulting luminous distribution over the sky dome. I was able to get this fast enough for both the 2D chart and 3D diagram to update reasonably dynamically whenever you change the date, time or location.
Added a
View from Sunbutton to the projections within theVIEW SETTINGSpanel.
0.0.3 2017-03-01
Added interactive alignment snapping to the faces and centers of proximate blocks. This highlights the aligned face in red and the center line in orange.
Added a
Snap to Allbutton that aligns with any block in the model, regardless of proximity. When snapped, highlights all aligned faces or centers across the whole model.Use the SHIFT key whilst dragging to temporarily toggle this option.Added a position/size editor panel which you can display by clicking the selection information overlay.
Added ability to set imperial/metric units as well as the cursor snap value within the
Unitstab of the position/size editor panel.
0.0.2 2017-02-20
Added a dynamic 2D Sun-path chart overlay that mirrors current shading. You can also export the resulting overshadowing chart as an SVG file to include in reports or your design documentation.
Added ability to choose different sky subdivision methods and the subdivision angle. To display these options, click the 2D Sun-path chart or the
SKY SETTINGSbutton.Added a
North Offsetslider and a redesignedSUN-PATH SETTINGSpanel.Fixed problem of some imported .OBJ models not generating shadows.
0.0.1 2016-11-28
- Initial release.
Comments
Sreejith Jayaram
Hello,
This is a great tool for architecture students and energy analysts for designing shading devices. However, It seems that I am unable to save the svg file.
To put it in a better way, The SVG gets saved which can be opened by my browser but the information inside the file seems to be missing. All I can view is the Sun path diagram and not the actual shaded region. Tried multiple times on different machines and problem still persists.
Dr. Andrew Marsh
Hi Sreejith,
Oops, I introduced a small bug when I updated a library recently. I’ve fixed it now so it should be working fine if you refresh the page.
I updated my apps to use a much faster WebGL shading display underlaid beneath the SVG chart. Unfortunately, in this particular tool I didn’t write the test for whether or not to regenerate the SVG shading properly when exporting. Fixed and tested now though.
Andrew