3D SUN-PATH
This app demonstrates the relationship between geographic location and solar position throughout the year. You can use the map to drag the location around and interactively see how the Sun-path diagram and shadow projections change. You can also directly relate location and the 3D Sun-path to day-length and a range of different 2D Sun-path projections.
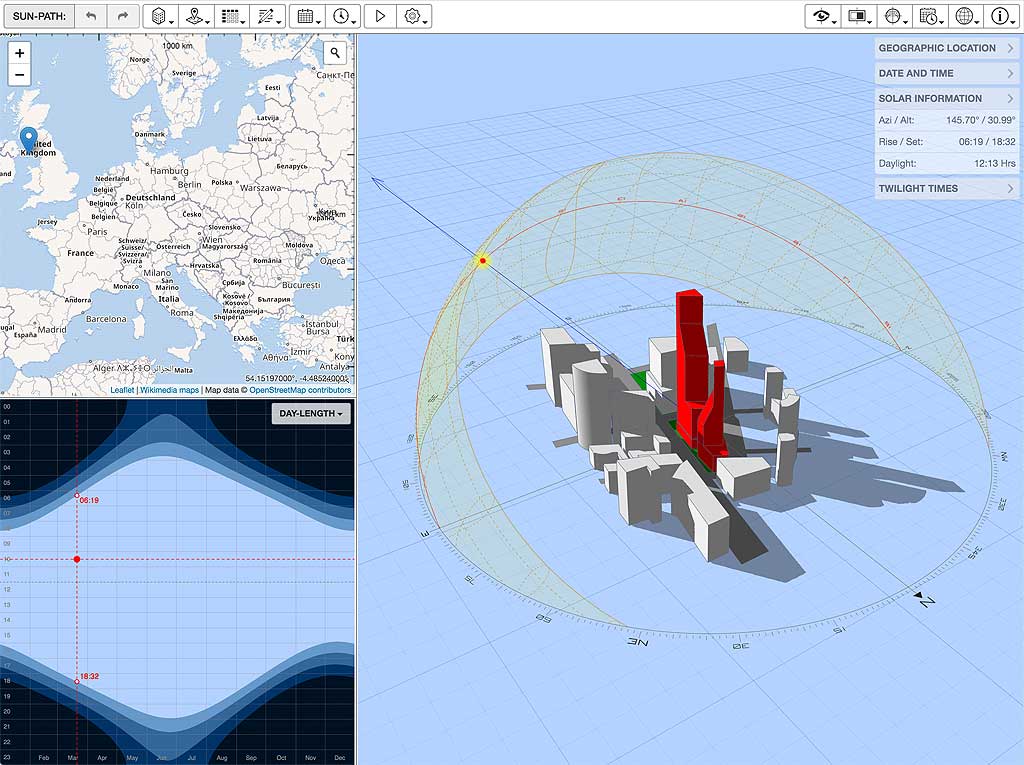
This app connects an interactive Google World Map to a 3D Sun-path diagram, shadow map generator and a 2D SVG chart displaying a range of solar information. The SVG chart defaults to showing the annual variation in day-length, but you can also select an analemma chart or several different types of 2D Sun-path diagram.
The aim was to clearly illustrate the relationship between geographic location and the annual Sun-path. It should be fast enough to update in pretty close to real-time as you drag the locator within the map or the date/time in the day-length chart. You can also use both the popover buttons and information panels located in the top-right to set the date, time and location. You can set the location using the map by either dragging the locator icon around or clicking in the position you want.
Background
This started out as an experiment to see just how responsive I could make the generation and display of 3D Sun-path diagrams and shadow projections using JavaScript and WebGL. I’m actually quite stunned as, even before any optimisation whatsoever, I found that I could build and rebuild the entire Sun-path mesh on every change in pretty well real time. Sure this was on an i7 processor, but it meant that the core technologies were not going to be the kind of bottleneck that I thought they’d be.
As it turned out, there was scope for some pretty fundamental optimisations, so now it’s even quick enough on an iPad as well as most of my old Android tablets.
SVG and WebGL
The marriage of WebGL for 3D visualisation and SVG for 2D data presentation also turns out to be a pretty happy one. The core ideas when working in both are actually pretty similar - building up a set of visual components that are cached and rendered separately (OpenGL vertex buffer objects and SVG elements respectively). Any complex calculations in Javascript need only be done once to build up each visual component, or to rebuild if it physically changes. The actual rendering of that cached element is then done by a much faster lower-level process (OpenGL/GPU and the SVG engine respectively).
Optimsation Potential
Thus, for the kinds of animated 2D charts I need, SVG seems to have much more optimisation potential than using a HTML5 canvas element. As the canvas element is pixel-based, any content change usually requires a full redraw of all chart components, each being re-described and/or re-generated in your own Javascript code. If any components require complex calculation or involve detailed curves, you have to devise your own caching system as this all has to be redone for every redraw.
With SVG charts, you only need to re-describe and/or re-generate those components that actually change on each redraw. All other previously defined components are automatically re-rendered by the SVG engine, which is a core part of the browser itself (running as native code) so is significantly faster than working in Javascript.
Thus, the key to fast animations is to offload as much work as possible onto the SVG engine, or even the browser rendering engine. This can be done by, for example, transforming components instead of regenerating them, using CSS3 animations and transitions, interpolating between pre-built elements instead of regenerating new elements each time, etc. For me, this is the really fun bit as you often have to completely rethink how to do things before you finally get that vital Eureka moment.
Change Log
0.0.6 2019-09-09
- Added back a simple place search feature in the world map. Just click the search icon in the top-right of the map to toggle the search block. To search, simply enter the number, street, suburb, town, zip/postcode and/or country, separated by commas and press the Enter key.
0.0.5 2019-03-03
- Added a new toolbar menu for selecting from a range of different map data sources for the Leaflet Map panel.
0.0.4 2019-02-26
- Moved to using Leaflet and OpenStreetMaps
instead of the Google Maps API as costs all of a sudden began to get way out of hand for such a small number of free educational tools. Unfortunately this also meant that the location search functionality was also removed as that was the most expensive bit (see comments below). There are a number of free options for replacing this, so I will work on adding that functionality back in as soon as I can.
- Added the ability to generate tabulated solar position data. To display a solar table, click the icon in the top-left toolbar that looks like a little grid of squares. You can also choose to save each different type of table as a comma-separated value (CSV) file.
0.0.3 2016-11-17
- Added ability to load in your own model geometry. To do this, either select the Load OBJ, STL or PLY… item in the Shadow Model menu or drag/drop a OBJ, STL or PLY file into the main application window. There are many ‘flavours’ of these file formats, so you may need to experiment with some of the other options in this same menu to get the geometry looking right.
0.0.2 2015-04-16
Converted ‘Sun-Path Components’ menu to a popover with checkboxes so that it stays visible whilst the user makes several selections.
Added ‘Settings Data’ () menu with options to import, view and edit application settings.
Added ability to store and reset current settings as the default startup configuration.
0.0.1 2015-02-12
- Initial release.
Comments
Shardul
Sir,
This is an awesome tool for understanding and getting us better with our architectural design. It has already helped me a lot !!
But hope so I could use high quality images from this for my presentation boards also.
Many thanks.
Dr. Andrew Marsh
Hi Shardul,
No problems. All my educational tools are freely and publicly available, so please feel free to take screenshots, generate charts or download models for use in any of your commercial and/or personal project documentation or presentations. A source acknowledgement is desirable on imagery used in published reports, but not entirely necessary as the overall aesthetic is quite readily recognisable.
Obviously you cannot take and sell the tools themselves or any of their source code, but access to them and anything produced by them is free and unencumbered.
Kind regards,
Andrew
Rio Gonzales
Hi!
Few months ago, I was able to use the app just perfectly but recently I have trouble entering the postcode of my site. I was wondering if there has been any changes that could affect this process?
Many thanks.
Dr. Andrew Marsh
Hi Rio,
Ahhh yes, sorry about that - should be fixed now though.
As of the 11th of June this year, Google changed access to its Maps API to require a Google Cloud account and introduced a new pricing structure that significantly reduced the free tier. Thus I had to rework how I used embedded maps within all my tools, including this one, and then enable and set up all the required APIs within my new Google Cloud account.
I obviously didn’t set the Places API up properly as the location search box seemed to work fine on my local machine (running on localhost), but would be rejected when running at andrewmarsh.com. I’ve gone through all the settings again and made sure they are the same as the Maps API and now it seems to be working.
So I guess all I have to do now is just sit back and wait for a ridiculous bill each month.
Kind regards,
Andrew
Dr. Andrew Marsh
UPDATE:
Yep - those ridiculous bills from Google did arrive.
Unfortunately, once I ran out of all the free credit given as part of the transition, using the Google Maps API in my tools started costing me more than AU$50 per day - on track to be over $20,000 for the year.
It was actually the place name search facility than was costing me the most. Google charge not only for the search, but also for each autocomplete as you type. Whilst there were around 10,000 map views a day, there were also more than 50,000 searches and a similar number of autocomplete charges. I don’t make money off any of these free tools so it’s hard to justify more than $20,000 a year to Google, plus having absolutely no control over what that figure might become if the tools suddenly got more popular.
Thus I have had to move to a free option, in this case Leaflet and OpenStreetMaps.
Kind regards,
Andrew
Silvana Boghozyan
Hi Mr. Andrew Marsh
Thank you for this amazing job, I really enjoy it.and is very useful for me as an Architecture student. I wonder if there is a way to save the video for using it for project presentation or so.
Thank you
Best
Silvana
Dr. Andrew Marsh
Hi Silvana,
If you use Google Chrome as your web browser, there are several web extensions that offer real-time video capture of the current web page and your interactions with it. For example Screencastify or Loom .
Also, there are a few tutorials out there that describe the process in detail, such as this one .
Hope that helps and good luck with your studies…
Kind regards,
Andrew
Rodrigo Maisterrena
Thank you Sir for such good apps. I’ve just imported a model from Revit into the app and it worked great. My students are going to love it. We miss all the tools from Ecotect (Weather tools, butterfly shadows, shadow tools etc) It´s a pity the Big Company didn´t follow up on its development, and has not implemented (or missed the target) this easy to use, high quality graphic aids on its platforms.
Thank you again on sharing your work, a lot of students will benefit from understanding how their projects are affected by the Sun, and how they affect their surroundings.
Saludos
Steph
Whenever I load a model, the materials come in crazy colors. I was wondering if there was a way to fix this, or if I’m doing something wrong. I tried changing materials in Sketchup and nothing worked. Also, is there any way to export a picture of the model, or can I only take a screenshot of it? Thank you!Dr. Andrew Marsh
Hi Steph,
Thanks for getting in touch and sorry that you are having problems with the colours…
One thing that the documentation isn’t very clear on (I will update it), is that you have to drag and drop both the .obj and the .mtl files together onto the web page at the same time. Unfortunately the tool will only process the material file as it is loading and creating the model data.
Having thought about it, this is a new feature that I should really add to the tool. You should be able to drag/drop a .mtl anytime after you have loaded the .obj file. The model should simply store the name of each material used and then update them when/if a new material file is dropped.
Also, unfortunately there isn’t a way to export a model or image other than via a screenshot. My web backend allows you to download models and data in a few different formats, but it’s a long way from complete at the moment and not something that I can easily link up to this tool.
I’ll let you know when I have updated the tool to support separately loading materials.
Hope that helps…
Andrew
Ghaidaa
As an architectural student this is really brilliant and helpful.
Our only problem was being unable to change the 3D that’s posted to get the accurate animation/pictures to fit our work.
If somehow we can be able to upload 3D files into the web which changes the one done already would be great.
Dr. Andrew Marsh
Hi Ghaidaa,
I do have a development version of that web app that lets you load your own .obj model files. You can find it at:
https://drajmarsh.bitbucket.io/sunpath3d.html
You can load a model using the ‘Shadow Model’ menu or by simply dragging and dropping your files into the browser window when that app is displayed. Because a web page within a browser cannot search your local file system, if your .obj file has associated .mtl files as well, make sure you select them all and drag/drop them as a group so it can use the right colors and materials.
As the format of models from different tools can vary, there are a number of options for fixing import issued inside the ‘Shadow Model’ menu. These allow you to rationalise surface normals and swap the Y and Z axis depending on how your model looks when it’s imported. This is a work-in-progress so I would be interested to hear about any issues you have or get your feedback.
Hope that helps…
Andrew